Monthly insights: Heron’s take on the recent private credit headlines (March 2026)
The coverage of private credit over the past several weeks has been striking, and it deserves a direct response. Here's our honest read on what's happening and what it means for private credit portfolios at Heron.

Monthly Insights #12, March 2026
In this issue:
- What the private credit headlines are covering and what the data says
- A note on fund withdrawal caps
- What this means for Heron portfolios
- Is private infrastructure the missing diversifier in your portfolio?
- Fund facts: 40+ years of real estate experience
- Quote of the month: Benjamin Franklin
Get a diversified private markets portfolio built to weather market volatility.
Heron’s take on this month’s private credit headlines
You've likely seen the headlines about private credit; it's been hard to miss. Fortune called it "the $265 billion private credit meltdown." CNBC declared that private credit's "zero-loss fantasy is coming to an end." NPR warned it could "lead to big trouble on Wall Street."
Here's our take on what's happening and what it means for private credit portfolios at Heron.
What the headlines are covering
The stress in private credit is real, but the turbulence making headlines this month traces back to two specific, connected problems:
- The first issue is retail-focused fund redemptions. Starting in late February, a cascade of non-traded business development companies (BDCs) managed by some of the largest private credit firms received redemption requests in excess of their pre-disclosed 5% quarterly thresholds. As a result, these managers exercised their discretion to limit or prorate redemptions, meaning not all investors who requested withdrawals are being fully paid out. Many (mostly retail) investors are now discovering that when these non-traded BDCs say 5% per quarter, they generally mean it—and that liquidity is not guaranteed.
- The second is a portfolio composition problem. Many of the funds drawing the most scrutiny also made concentrated bets, in some cases on leveraged loans to software companies — a sector now facing disruption from artificial intelligence. BlackRock wrote a $25 million loan to Infinite Commerce Holdings from 100 cents on the dollar to zero in a single quarter. Software borrowers represent an estimated 26% of major BDC holdings — and that concentration is where the most acute credit stress is currently playing out.
These are legitimate issues. Retail redemptions and tech sector exposure are issues worth taking seriously, but there are important data points that many of the headlines miss or don’t go into detail, which distorts the narrative from reality.
What the data says
Before extrapolating to a broader crisis as many of the headlines do, consider the context:
- The Wall Street Journal reported that investors “have yanked more than $11 billion out of private-credit funds during the past two quarters.” While $11 billion is a large amount, it represents less than 1% of total private credit AUM.
- The vast majority of the market sits in time-tested drawdown funds, primarily held by institutional investors such as pension funds and insurance companies, operating as designed.
- Most of the headlines center on retail investors — which together with the mass affluent channels accounts for roughly 24% of the private credit market. About 76% of the private credit investor base is institutional investors who have been allocated to this asset class for about two decades. Institutions are generally not reacting to short-term headlines the same way as retail investors.
- Private credit is only ~9% of total U.S. corporate borrowing — significant, but not systemically dominant like the lending issues that triggered the 2008 global financial crisis that headlines are comparing the current situation to.
- Despite recent turbulence, direct lending (private credit) has outperformed broadly syndicated loans (public credit) by +2.7% (1-year), +3.8% (5-year), and +3.7% (10-year) as of September 2025.
On top of the data, J.P. Morgan's Private Bank reported that “Recent headlines have conflated market sentiment with systemic risk. Based on our view, fears of a private credit led crisis are overstated.” Interestingly, even with all of the headlines, J.P. Morgan is actively planning to launch its own private credit fund. It’s an interval fund called JPMorgan Public and Private Credit Fund that will invest “a substantial portion” of its assets in private credit, according to the bank's SEC filing last week.
Goldman Sachs echoed J.P. Morgan, stating “Private credit appears unlikely to pose a significant financial system risk because investments are not concentrated, leverage is limited, and assets and liabilities are well matched.”
That said, one thing that both J.P. Morgan and Goldman also agree on (and we do too) is:
Manager selection has never mattered more. We’ll likely continue to see a widening range of performance outcomes between the “best” and “worst” funds.
A note on fund withdrawal caps
We think that one narrative framing redemption caps as a red flag deserves a reframe. Of course an increase in redemption requests is not a positive event for investors who want to exit, but as Blackstone President Jon Gray argued recently, the withdrawal caps in these products are "really a feature, not a bug... What you're doing is trading away a bit of liquidity for higher returns."
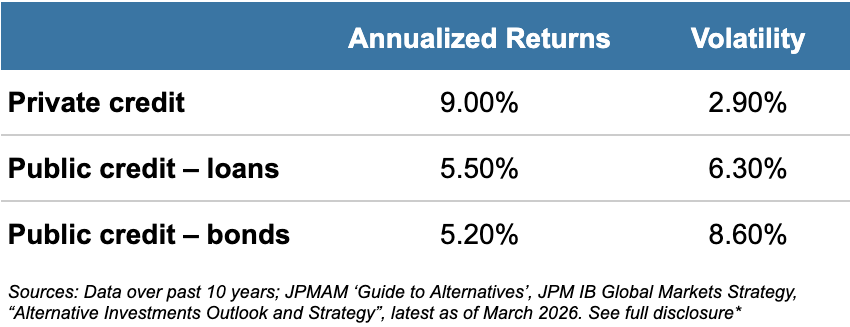
Private credit has historically offered a differentiated source of income, the potential to outperform the public credit markets (e.g., leveraged loans and high yield bonds), and attractive cash yields with lower volatility, as shown below:
The current stress in semi-liquid vehicles like non-traded BDCs isn't evidence that private credit is broken — it's evidence that some vehicles were sold to investors who didn't fully understand the tradeoff they were making. Withdrawal caps are part of these funds’ structures and without them, two things can occur: One, a run on the funds, and two, lower returns.
In an interview with the BBC this month, BlackRock CEO Larry Fink defended the 5% quarterly redemption limit for non-traded BDCs as intentional and established policy, framing it as BlackRock's "fiduciary duty to each and every client." He elaborated: "if I allow more people to redeem, I'm not fiduciary to those who are staying in." This is an important point. We have noted that the majority of retail investors are actually staying invested in private credit; for those investors, the 5% redemption limit can help preserve their collateral. This was actually the point I made during Heron’s interview with Bloomberg last summer. In that article, I discussed “a delicate balance between targeting higher returns and maintaining sufficient liquidity” and I argued that, “The practice of gating — or limiting withdrawals — can be useful to manage flows and reduce the risk of premature, forced asset sales.”
These withdrawal caps are a normal aspect of fund structures like non-traded BDCs. This is a risk-management feature that institutional investors in private credit have understood for decades as they often lock their capital for upwards of seven to 10 years. Retail investors can improve their investment choices by understanding the features of these fund structures.
What this means for Heron portfolios
It is tempting to conflate fund redemption with fund performance, but these are two separate issues. Yes, the private credit funds on Heron have similar redemption policies as discussed in the news, but no, we have not experienced elevated credit risks in our portfolio at this time.
For example, in our response to the Blue Owl situation last month, we provided an illustrative comparison showing non-accruals of 0.5% for the average fund in the Heron private credit program vs. 4.2% for the Blue Owl fund, and our last 12-month total returns being 9.5% net of fees vs. 3.7% for Blue Owl.
Despite headwinds that have pressured the returns of private credit ETFs and many of our peer funds, our private credit strategies generated clients average annualized net returns of 8.0% to 10.4% depending on the strategy as of January 2026.**
At Heron, our private credit portfolios are structured to mitigate a broad range of risks:
- Multi-manager exposures: Our private credit strategies are composed of 12 funds, which is designed to reduce exposure to manager or sector-specific stress. We apply a rigorous underwriting process to manager selection, with track records evaluated across multiple credit cycles, with the goal of helping you avoid placing investments into lower performing funds.
- Manager scale and track record: Our credit managers collectively manage over $1 trillion in private credit assets — more than half of the global market. With an average track record spanning over two decades, these battle-tested, institutional lenders have invested through multiple credit cycles.
- Diversified funding sources: The average private credit fund in the Heron portfolio today has access to nine different financing sources per fund, and this number has been increasing.
- Portfolio diversification: The underlying loan portfolio spans nearly 4,000 assets across diverse sectors, from lower middle market to upper middle market, without a material industry concentration risk.
- Some clients have asked us about our software exposure and our answer is that yes, we have some software exposure given its role, as an industry, in the U.S. economy, but this is not our largest exposure. The largest exposure for most of our private credit funds (especially our largest-exposure funds) is actually Industrials, a broad category that includes everything from aerospace and defense to transportation infrastructure and everything in between, followed by Health Care.
- With respect to software, it does not make sense to equate the recent selloffs in software stocks with fundamental credit risk in senior secured lending (Heron’s primary focus) because the return paradigms and structure between equity and debt investing are very different.
- High-quality assets: More than 90% of Heron’s private credit assets are first lien loans, with an average loan to value ratio as low as ~40%, non-accrual rate as low as ~0.5%, and payment-in-kind interest income as low as ~3% of total investment income (as of September 2025). The underlying borrower generated a profit of $100+ million last year on average, with an interest coverage ratio at 2.2x (i.e., cash flows being more than twice as much as interest expense).
To be clear, we're not dismissing the challenges in the private credit market. Dispersion in performance is widening, and some managers will face real difficulties. Like stocks, private credit has its winners and losers. That's not a flaw—that's just how markets work. But here's what matters: the headlines are fixating on a specific, identifiable corner of the market. While risks are clearly present, we're not seeing the widespread cracks in the system that some are suggesting.
We'll continue to monitor closely and keep you updated. And if you need support with your account, reply to this email or schedule a call with our team.
As always, thanks for reading,
Heron Chief Credit Officer
From the Heron Blog
- Is private infrastructure the missing diversifier in your portfolio?
- Staying invested historically drives higher returns
Heron fund facts
Fact: Heron’s new private real estate strategy features managers who on average have 40+ years of experience managing real estate investments.
Why that matters: Real estate cycles tend to run 12-15 years or longer, which means most fund managers will experience only one or two complete cycles. Managers with 40+ years bring genuine battle-tested judgment across multiple cycles — that's rare in real estate today. Learn more about Heron’s private real estate strategy.
Quote of the month
"He that can have patience can have what he will."
– Benjamin Franklin
Get a diversified private markets portfolio built to weather market volatility.
*Data over past 10 years; JPMAM ‘Guide to Alternatives’, JPM IB Global Markets Strategy, “Alternative Investments Outlook and Strategy”, latest as of March 2026. Source: JPMAM Guide to Alternatives, Bloomberg, Cliffwater, Gilberto-Levy, Preqin. Direct Lending: Cliffwater Direct Lending Index; Distressed Debt: Preqin Quarterly Distressed Debt index; Investment Grade: Bloomberg US Aggregate Credit - Corporates - investment Grade Index; High Yield: Bloomberg US Aggregate Credit - Corporate - high Yield Index; Leveraged loans: JP MOrgan Leveraged Loan Index; Mezzanine Debt: Preqin Quarterly Mezzanine Debt Index. Annualized return and volatility represents a 40-quarter period ending 12/31/2024. Data are based on availability as of January 31, 2026. (Originals: https://privatebank.jpmorgan.com/apac/en/insights/markets-and-investing/private-credit-under-the-microscope-separating-headlines-from-fundamentals, https://privatebank.jpmorgan.com/eur/en/insights/markets-and-investing/ideas-and-insights/the-good-news-behind-the-bad-private-credit-headlines)
**Average client return after fees is an annualized return calculated as the average actual returns of all Heron clients as of January 2026. All returns are shown after Heron's 1% management fee has been deducted, with interest automatically reinvested. Return represents overall performance, including interest earned and net changes in principal (accounting for any appreciation/depreciation). This is intended for informational purposes only and does not guarantee future performance or results. Actual returns may differ from the projected rates, and your investment may not achieve the same results as shown.