Monthly insights: Making sense of new data (September 2025)
In this edition of Monthly Insights, we’ll give you a peek behind the curtain to show you some of the current trends we shared with CreditSights for their institutional audience — and as always, what it all means for you as an investor.

Monthly Insights #6, September 2025
In this issue:
- Current Events: Making sense of new data
- Non-accruals: Heron vs Peer Group
- Quote of the month from Walter Cronkite
Current events: Making sense of new data
At Heron, we review thousands of data points from over 60 of the largest private credit funds each month. This results in a lot of analysis and findings that we share within the industry.
For example, this month we provided proprietary data to CreditSights, a division of Fitch Group that provides independent credit research and market data.
In this edition of Monthly Insights, we’ll give you a peek behind the curtain to show you some of the current trends we shared with CreditSights for their institutional audience — and as always, what it all means for you as an investor.
A dive into the data: Non-accruals
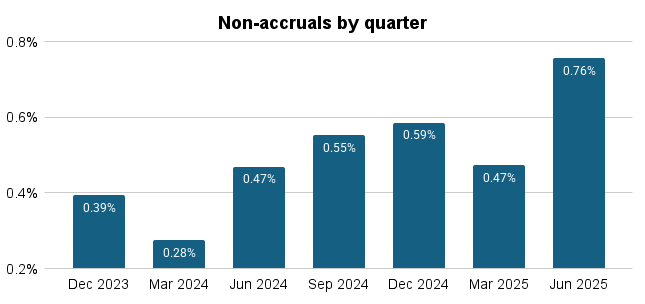
The detailed trend data we shared with CreditSights focused on non-accruals across the private credit industry. Think of non-accruals as loans that have “gone silent.” When a loan is placed on non-accrual, the borrower has stopped making scheduled interest or principal payments—a signal worth watching, as it can be an early sign of potential credit loss.
In Q2 2025, when looking at industry-wide data, the share of loans on non-accrual status ticked up to 0.76%, compared with 0.47% a year ago.
So far, this increase has been concentrated among Lower Middle Market borrowers (i.e., companies with less than $25 million in earnings). By contrast, Upper Middle Market borrowers (those with earnings above $75 million) have remained resilient.
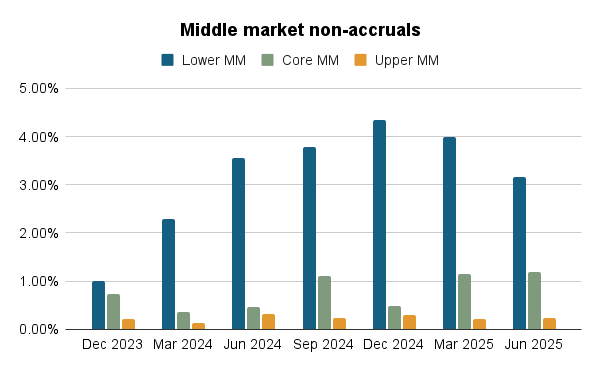
Does that mean Upper Middle Market lending is safer?
No, not necessarily. Non-accruals are just one data point and don’t always translate into credit losses. Recovery rates often depend on factors like first-lien positioning, loan-to-value ratios, and leverage ratio.
For example, as of Q2 2025, the average debt-to-earnings ratio was 3.8x for Lower Middle Market borrowers versus 5.5x for Upper Middle Market.
And when we look at PIK interest—another risk measure we keep a close eye on—we see it was 2.6% in the Lower Middle Market and 4.0% in the Upper Middle Market. Four percent is somewhat high, yes, but not a concern on its own.
What does it mean for investors?
The takeaway for investors like you: credit risk is multi-dimensional, and no single data point tells the whole story. If you see a news article highlighting one single metric, be cautious of drawing large scale conclusions about an asset class.
Overall, we remain confident in private credit—especially our approach at Heron—because when we look across metrics we see:
- Loan-to-value ratios remain healthy at around 40% (compared with 60%+ prior to the Global Financial Crisis).
- Interest coverage ratios continue to improve, at 1.90x as of Q2 2025, up from 1.78x a year ago and 1.60x at the end of 2023.
- Diversified, multi-manager portfolios (a core of Heron’s offering) have consistently outperformed across key risk measures as we saw in our recent performance announcement.
As always, thanks for reading,
Heron Chief Credit Officer
Heron fund facts
Fact: The average fund in Heron portfolios reports 0.0% non-accruals as of Q2 2025 compared to 1.1% for our peer group.*
Why that matters: Non-accruals can be an early sign of potential credit loss. As an investor in private credit, you can use non-accruals to compare the overall health of different funds or portfolios.
Quote of the month
“In seeking truth you have to get both sides of a story.”
– Walter Cronkite
Get a diversified portfolio built for market volatility.
*Dataset source: SEC filings for June 2025. Dataset includes over 60 of the largest U.S. private credit funds, which are actively managed by firms that collectively manage in excess of $1 trillion in private credit assets across their funds and accounts. Percentages shown as medians. Funds on Heron includes funds being made available through Heron as of August 2025. Peer group includes all funds in the dataset but excludes Heron funds. Notes: PIK Interest shown as PIK interest income as percentage of total investment income into the fund. Non-Accruals shown on a cost basis.