Monthly insights: What you need to know about private credit BDCs (January 2026)
In this Monthly Insights, we review the different types of private credit business development companies (BDCs), and why a publicly listed BDC or a BDC ETF may result in different risk-return profiles, even though they are easy to access.

Monthly Insights #10, January 2026
In this issue:
- What you need to know about private credit BDCs
- Why invest in private infrastructure?
- New private credit benchmark report
- Fund facts: 13.5% annualized returns after fees from infrastructure funds
- Quote of the month: Aristotle on quality
Get a diversified private markets portfolio built for market volatility.
What you need to know about private credit BDCs
At Heron, we hear from investors who are considering investing in—or who already are invested in—business development companies (BDCs) as a means of gaining exposure to private credit.
In this Monthly Insights, we review the different types of BDCs and why a publicly listed BDC or a BDC ETF may result in different risk-return profiles, even though they are easy to access.
First, what are private credit BDCs?
Private credit BDCs are regulated investment vehicles that lend primarily to middle-market private companies (generally defined as businesses with revenue between $10 million and $1 billion), offering investors access to private credit in a liquid or semi-liquid structure.
There are two primary types of private credit BDCs:
- Publicly listed BDCs: These funds trade on stock exchanges like equities. They typically offer daily liquidity and continuous market pricing, but their share prices may trade at a premium or discount to net asset value (NAV) and can experience higher volatility driven by broader equity market conditions.
- Unlisted (non-traded) BDCs: These are the types of BDCs available on Heron. These BDCs do not trade on public exchanges and instead offer periodic liquidity, typically with less price volatility and pricing based on reported monthly NAV rather than real-time market prices.
Publicly listed BDCs are underperforming
The past year has been painful for investors holding publicly listed BDCs—again, not to be confused with the non-traded BDCs that we offer access to on Heron.
For example, the largest listed BDC ETF by assets, BIZD, is down over 6% during the past 12 months (as of 1/26/26). Of course this is the public markets and your guess is as good as mine as to where performance will be in 12 months, but given the significantly negative performance, it’s important to take a deeper dive, especially if you’re considering investing in these publicly listed vehicles.
Our analysis at Heron points to fundamental weaknesses across publicly listed BDCs—not merely trading dynamics—that have underpinned their prolonged underperformance.
Let’s take a look at some risk metrics as of Q3 2025:
PIK:
- What is it? PIK, short for payment-in-kind, allows borrowers to defer some or all of their cash interest payments by accruing them to the loan’s principal balance.
- Why does it matter? Generally speaking, for a private credit portfolio, PIK interest income as a percentage of total investment income below 5% suggests no broad concerns and levels above 5% could indicate emerging stress.
- Q3 2025 PIK: 3.8% industry wide, 3.1% non-traded BDCs, 5.3% publicly listed BDCs, 3.1% for funds available on Heron.
Non-Accruals:
- What is it? Non-accruals measure the share of loans that have stopped paying interest, often signaling borrower distress or potential credit losses.
- Why does it matter? Elevated non-accrual rates can foreshadow realized losses, as these loans may ultimately result in partial or full principal write-downs.
- Q3 2025 Non-Accruals: 0.9% industry-wide, 0.3% non-traded BDCs, 2.7% publicly listed BDCs, 0.0% for funds available on Heron.
Loan Valuation (FMV):
- What is it? Fair market value (FMV) reflects what the loan could be sold for today in the market, providing insight into credit quality.
- Why does it matter? All else equal, portfolios with a higher share of first-lien, higher-quality loans tend to maintain higher FMVs. Lower FMVs can indicate increased risk of missed interest payments and/or principal losses.
- Q3 2025 Loan Valuation (FMV): 99.6% industry-wide, 99.8% non-traded BDCs, 98.4% publicly listed BDCs, 100.5% for funds available on Heron—all expressed in terms of first lien loan FMV as a percentage of cost.
Underperformance:
- What is it? Underperformance captures the percentage of loans in the portfolio that the underlying credit managers believe are lagging their own expectations. Most of these loans are not currently in default, but because of their underperformance may eventually lead to non-accruals and capital losses.
- Why does it matter? While somewhat subjective, this metric can serve as an early warning signal for credit stress within portfolios in the next few quarters.
- Q3 2025 Underperformance: 6.7% industry-wide, 3.5% non-traded BDCs, 10.6% publicly listed BDCs, 1.7% for funds available on Heron.
The underperformance of publicly listed BDCs, which account for less than 10% of the ~$2 trillion private credit market, across these risk metrics appears to be a reflection of fundamental credit issues specific to those portfolios, rather than a sign of industry wide trend. Credit metrics observed across non-traded BDCs, including those on the Heron platform, have been more stable during the period reviewed, which may indicate relative resilience within segments of the private credit market.
Why Heron focuses on non-traded BDCs
Non-traded BDCs available on the Heron platform have generally exhibited lower reported volatility and stronger credit metrics relative to publicly listed peers. Additionally, non-traded BDCs are not subject to market swings as they are priced on monthly NAV.
Take a look at the monthly total returns comparing funds available on Heron to the VanEck BDC Income ETF:
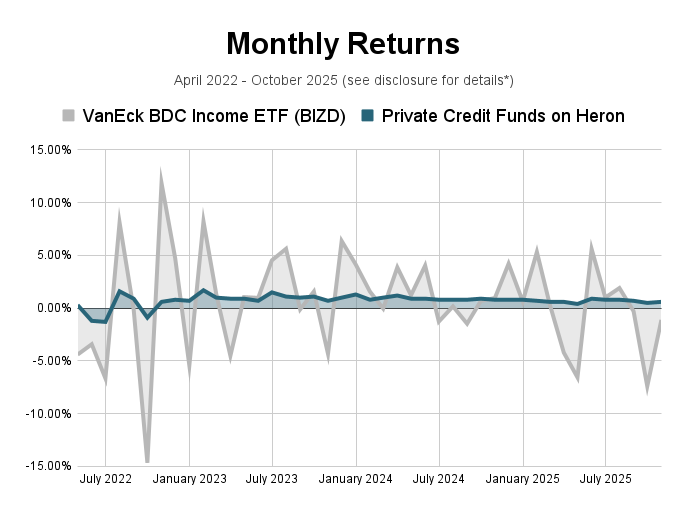
Heron’s private credit strategy has exhibited lower volatility which may limit potentially-sharp interim drawdowns during periods of market stress.
At the end of the day, as most non-traded BDCs (including those in your Heron private credit portfolios) were launched after 2021, they typically include loans from more-recent vintage years, with pricing and underwriting aligned to higher interest rates and current economic conditions. It’s important to note that, despite these funds’ recent formation, the underlying credit managers have substantially longer operating histories—averaging more than two decades across private credit managers currently on Heron.
Meanwhile, most publicly listed BDCs were formed pre-COVID and still carry legacy loans, many of which originated between 2018 and 2021 in a near-zero interest rate environment. As a result, investors looking to “buy the dip” with publicly listed BDCs still need to consider these funds’ fundamental credit issues. The key question is: Will those underperforming PIK loans manifest into full-blown credit losses–and when? These publicly listed funds’ discount to NAV, while attractive on the surface, could ultimately prove to be a falling knife.
At Heron, we’ve historically outperformed various benchmarks, as outlined in our year-end letter, and continue to believe that our private credit strategies present compelling characteristics over publicly listed BDCs and BDC ETFs in terms of higher credit quality, lower volatility, and sustainable risk-adjusted returns.
As always, thanks for reading,
Heron Chief Credit Officer
From the Heron Blog
- Why invest in private infrastructure in 2026? 3 charts for investors
- State of Private Credit Benchmark Report (Q1 2026)
Heron fund facts
Fact: The 5 funds in our new private infrastructure strategy have delivered an average 13.5% annualized return after fees since their inception.**
Why that matters: There are many options for investors to choose from when it comes to infrastructure investing. At Heron, we carefully select the fund managers who have historically delivered higher returns for investors. Learn about our private infrastructure strategy.
Quote of the month
“Quality is not an act; it is a habit.”
– Aristotle
Get a diversified private markets portfolio built for market volatility.
*The VanEck BDC Income ETF data on this graph represents the monthly returns as reported by VanEck here: https://www.vaneck.com/us/en/investments/bdc-income-etf-bizd/downloads/one-month-returns/. The Heron data on this graph represents the annualized monthly returns and interest of an equal weighting of the private credit funds available on Heron, since each fund's inception date up to the last month of completed data. Data is typically completed within 3 months. Charted returns and interest are shown after Heron's 1% management fee has been deducted, with interest automatically reinvested. Return represents overall performance, including interest earned and net changes in principal (accounting for any appreciation/depreciation). This is intended for informational purposes only and does not guarantee future performance or results. This projection factors in compounded interest but does not account for potential changes like withdrawals, interest rate fluctuations, or management fees, which could impact actual outcomes. Actual returns may differ from the projected rates, and your investment may not achieve the same results as shown in the illustration. Investments in private credit funds are subject to market risks, including the potential loss of principal. Other factors in the illustration may also differ from actual investment outcomes.
**Represents the annualized returns of an equal weighting of the private infrastructure funds available on Heron, since each fund's inception date up to the last month of completed data. Data is typically completed within 3 months. Returns are shown after Heron's 1% management fee has been deducted, with interest automatically reinvested. Return represents overall performance, including interest earned and net changes in principal (accounting for any appreciation/depreciation). This is intended for informational purposes only and does not guarantee future performance or results.