The state of private credit benchmark report (Q1 2026 edition)
Key takeaways from an analysis of 71 of the world’s most established private credit funds.

The Q1 2026 edition of the State of Private Credit Benchmark Report analyzes key private credit portfolio and performance metrics using the median of quarterly fund-level data derived from SEC filings and manager reporting as of the end of Q3 2025. The analysis spans 71 private credit funds managed by firms with more than $1 trillion in aggregate private credit assets under management, providing a broad and institutionally representative view of market conditions. Metrics are presented over time to highlight trends in portfolio quality, risk characteristics, and return dynamics across the private credit market.
Executive commentary:
- PIK interest remains healthy: Payment-in-kind (PIK) interest is marginally lower in Q3 2025 as compared to Q1 and Q2 2025. Overall, this is generally in line with historical average.
- Non-accruals are marginally higher but still below long-term historical level: Non-accruals continued to tick up ending Q3 2025 at 0.9%, with Lower Middle Market funds displaying the highest rates. On an absolute level, however, non-accrual trends are not concerning considering the fact that the historical realized loss rate for this asset class is approximately 1% annually over the last two decades.
- Lower interest rates drive down leverage: From an average corporate borrower’s perspective, leverage ratio (debt/EBITDA) and interest coverage ratio (EBITDA/interest) continue to marginally improve, in part due to interest rates continuing to decrease over the last few quarters.
- Loan quality is stable: We don’t see material credit risk deterioration at the industry level, especially considering the fact that at the end of the day, loan-to-value ratio (LTV) remains healthy at about 40% and that approximately 90% of the loan assets are first lien loans, which historically recovered well above 50% in a default scenario.
The benchmark report provides two years of historical data for the following metrics:
- PIK interest
- Non-accruals
- Credit loss (net)
- First lien loan FMV / cost
- Borrower debt / EBITDA
- Borrower interest coverage
- Average LTV
- Debt / equity
- Underperformance
- Effective loan yield
- Annualized quarterly total returns
All metrics are calculated as the median of quarterly fund data based on SEC filings and fund reporting.
1) PIK interest
PIK interest below 5% suggests no broad concerns. Levels above 5% could indicate emerging stress, and levels above 10% would signal more widespread, systemic stress across the industry.

Metric calculation note: PIK interest income is calculated as a percentage of gross total investment income.
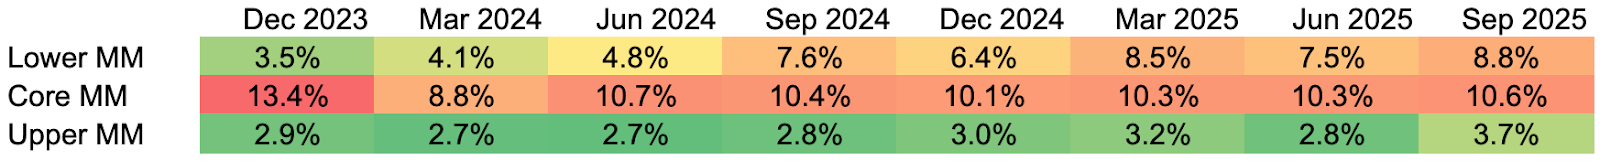
2) Non-accruals
Non-accrual levels ticked up modestly but remain low overall, especially by historical standards, particularly in upper middle market portfolios. This points to resilient borrower performance and active credit management.

Metric calculation note: Non accruals is calculated as a percentage of total investments portfolio, based on cost.
3) Credit loss (net)
The following graph shows trailing 12-month realized losses. We see that net realized credit losses remain minimal and stable across periods. Even amid macro pressure, losses have stayed well within historical norms.

Metric calculation note: Credit loss (net) is calculated as trailing 12-month realized investment loss, net of gain, as a percentage of average fund net asset value.
4) First-lien loan FMV / cost
First-lien loan fair market values (FMV) remain close to par, indicating limited stress. This reflects strong collateral coverage and conservative underwriting.

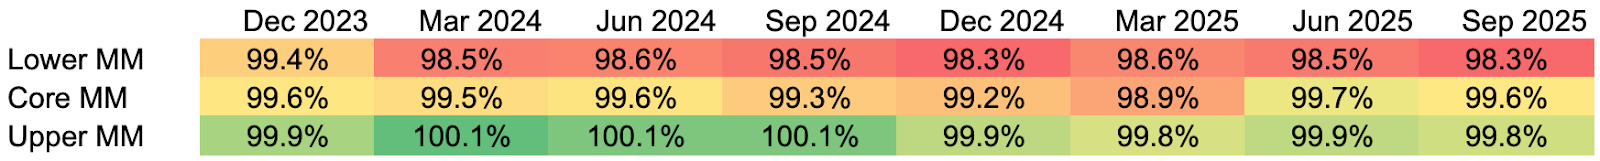
Metric calculation note: First lien loan FMV / cost is calculated as the first lien loan fair market value divided by the cost.
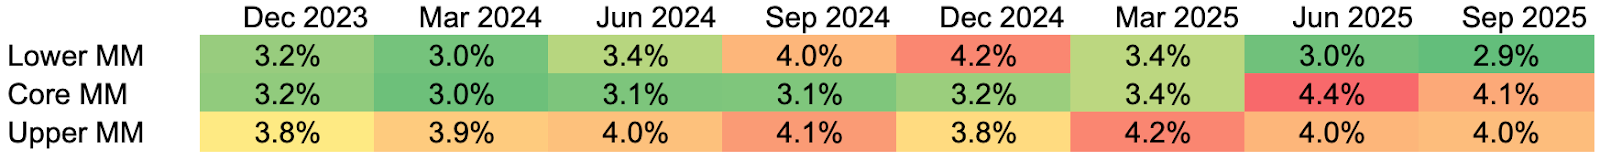
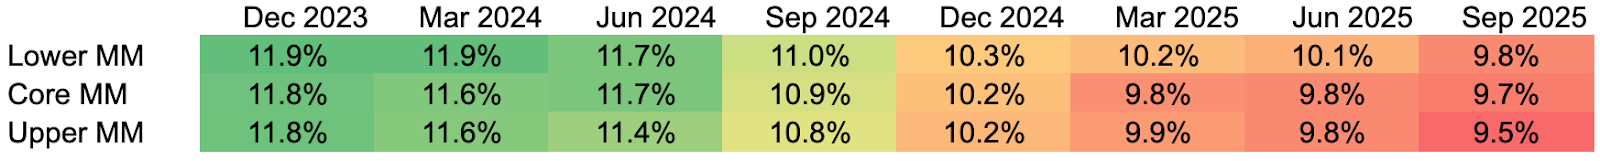
5) Borrower debt / EBITDA
Leverage levels have been broadly stable, with no material upward drift. This suggests lenders have maintained discipline on borrower leverage despite competitive deal markets, and that the borrower balance sheet has remained relatively stable in the last two years.

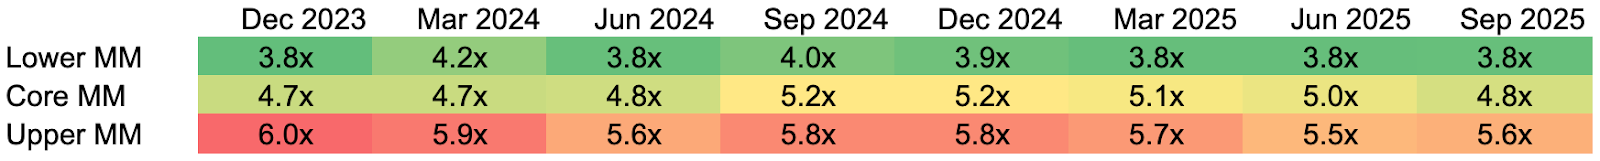
Metric calculation note: Borrower debt / EBITDA is the leverage ratio of the average corporate borrower.
6) Borrower interest coverage
Interest coverage ratios have marginally improved, in part due to three interest rates cuts during 2025.

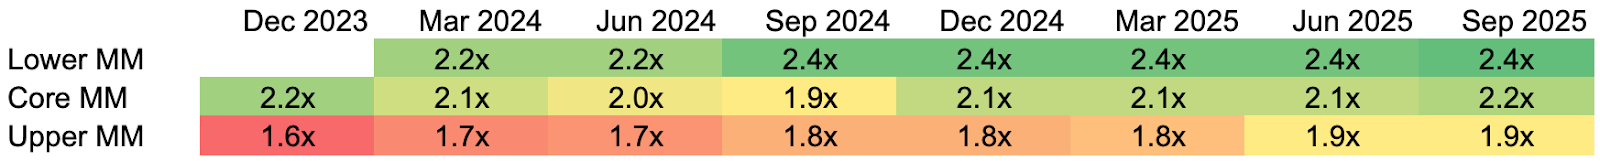
Metric calculation note: Borrower interest coverage is calculated as EBITDA divided by interest expense of the average corporate borrower.
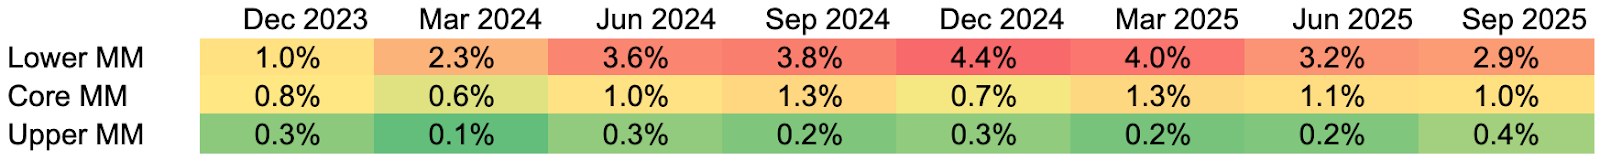
7) Average LTV
Loan-to-value ratios remain conservative across segments. Stable LTVs indicate lenders have not materially loosened structural protections. Such low LTVs allow for a significant first-loss capital cushion should the credit markets deteriorate.

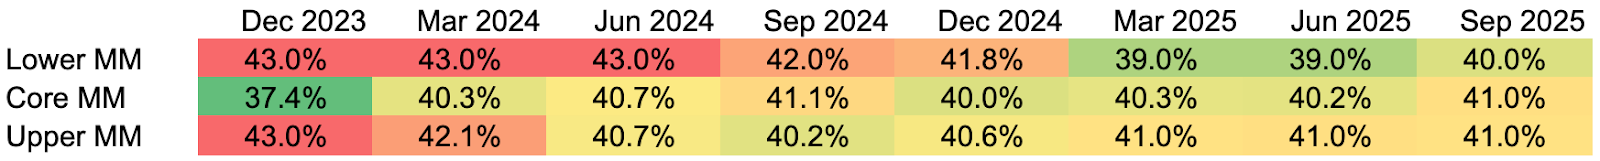
Metric calculation note: Average LTV is calculated as the average loan to value ratio.
8) Debt / equity (fund-level leverage)
Fund-level leverage varies by strategy but remains controlled overall. This is in line with expectations and limits potential amplification of losses during periods of market stress.

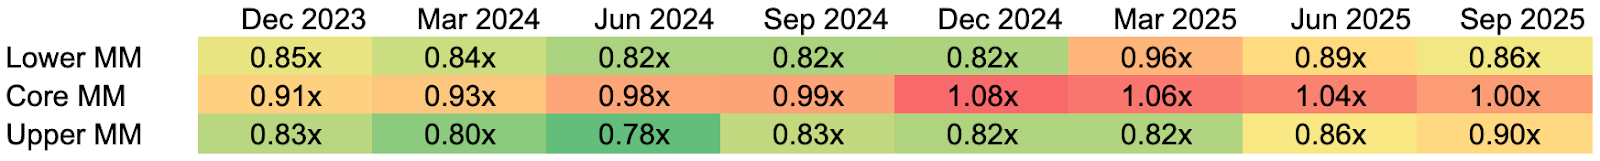
Metric calculation note: Debt / equity is calculated as the average fund-level leverage ratio.
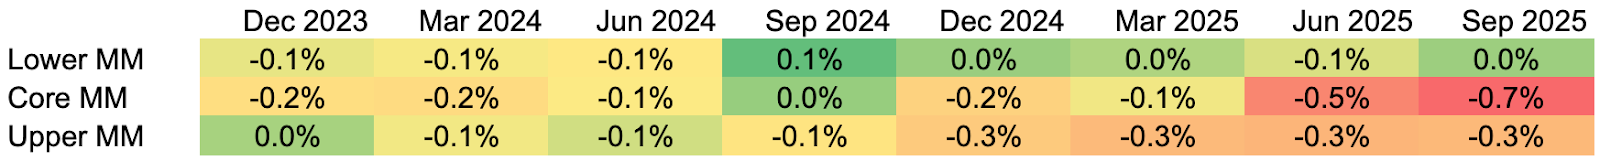
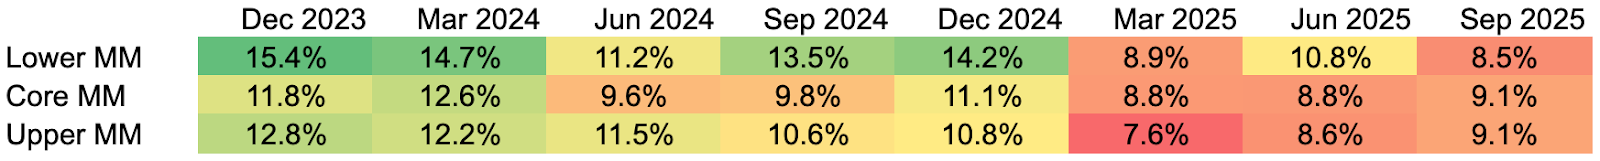
9) Underperformance
The percentage of loans performing below fund managers’ expectations has risen, but this trend has been concentrated in a limited number of funds. This suggests potential dispersion in non-accruals and losses across managers in 2026, underscoring the growing importance of thoughtful fund selection and portfolio diversification.

Metric calculation note: Underperformance is calculated as the percentage of total investments in a portfolio performing below fund manager's expectations.
10) Effective loan yield
Effective yields declined from peak levels but remained elevated versus pre-hiking cycles. This reflects the lagged reset of floating-rate assets and portfolio repositioning.

Metric calculation note: Effective loan yield is calculated as the weighted average asset returns shown as yield based on cost.
11) Annualized quarterly total returns
Returns normalized after exceptionally strong periods, settling into a more sustainable range. Performance dispersion across segments has narrowed over time.

Metric calculation note: Annualized quarterly total returns are calculated as the investor IRR shown as quarterly returns on an annualized basis.
About Heron Finance
Heron Finance provides individual investors and family offices with diversified private market investment portfolios with exposure to 20+ funds across 10,000+ private credit, private equity, and private infrastructure investments.
With Heron Finance, individual investors gain access to established private market investments while benefiting from:
- A fully digital investing experience
- Low minimum investments
- One consolidated tax form
- Monthly subscriptions
- No multi-year lockups
- 1% management fee
- No capital calls
Individual investors can invest with Heron in three steps:
- Get a personalized portfolio recommendation — Complete a quick quiz to assess your risk and return preferences. Heron's algorithm builds a tailored private markets portfolio by selecting from experienced institutional funds based on rigorous proprietary scoring criteria.
- Fund your investment — Choose a standard or IRA account, transfer funds via ACH or wire, and verify your accredited investor status.
- Track your returns over time — Once invested, Heron optimizes your portfolio over time and provides a detailed breakdown of your portfolio returns and interest.
See how to invest in private markets with Heron Finance.
Data sources: All metrics are calculated as of Q3 2025 as the median quarterly fund data, based on SEC filings and fund reporting from 71 private credit funds managed by firms with greater than $1 trillion in aggregate private credit AUM. Lower MM refers to lower middle market companies, which report annual EBITDA of less than $25 million; core MM refers to core middle market companies, which report annual EBITDA greater than $25 million but less than $75 million; and upper MM refers to upper middle market companies, which report annual EBITDA greater than $75 million.
Metric explanations:
- PIK interest: PIK interest income as a percentage of gross total investment income
- Non-accruals: Non accruals as a percentage of total investments portfolio, based on cost
- Credit loss (net): Trailing 12-month realized investment loss, net of gain, as a percentage of average fund net asset value
- First lien loan FMV / cost: First lien loan fair market value divided by cost
- Borrower debt / EBITDA: Leverage ratio of average corporate borrower
- Borrower interest coverage: EBITDA divided by interest expense of average corporate borrower
- Average LTV: Average loan to value ratio
- Debt / equity: Average fund-level leverage ratio
- Underperformance: Percentage of total investments portfolio performing below fund manager's expectations
- Effective loan yield: Weighted average asset returns shown as yield based on cost
- Annualized quarterly total returns: Investor IRR shown as quarterly returns on annualized basis
Any financial forecasts or financial returns, whether in the form of interest or appreciation displayed on this website are for illustrative purposes only and are not a guarantee of future results. Private credit investments are subject to credit, liquidity, and interest rate risk. In the event of any default by a borrower, you will bear a risk of loss of principal and accrued interest on such loan, which could have a material adverse effect on your investment. A borrower may default for a variety of reasons, including non-payment of principal or interest, as well as breaches of contractual covenants. Credit risks associated with the investments include (among others): (i) the possibility that earnings of a borrower may be insufficient to meet its debt service obligations; (ii) a borrower's assets declining in value; and (iii) the declining creditworthiness, default, and potential for insolvency of a borrower during periods of rising interest rates and economic downturn.