The state of private credit benchmark report (Q2 2026 updated edition)
Key takeaways from a Q2 2026 updated analysis of 69 of the world’s most established private credit funds in the U.S.

The Q2 2026 updated edition of the State of Private Credit Benchmark Report analyzes key private credit portfolio and performance metrics using the median of quarterly fund-level data derived from SEC filings and fund reporting as of Q1 2026.
About the State of Private Credit Benchmark report
- The analysis spans 69 U.S. private credit funds, which are further segmented based on underlying borrower size.
- The dataset includes both publicly-listed and non-traded fund vehicles which are managed by firms with more than $1 trillion in aggregate private credit assets under management, providing a representative view of trends and conditions of the private credit market in the U.S. today.
- Metrics are presented over time to highlight trends in portfolio quality, risk characteristics, and return dynamics across the private credit market.
Executive commentary
- PIK interest remains healthy: Payment-in-kind (PIK) interest marginally decreased in Q1 2026 to 3.9%.
- Non-accruals are moderately high: Non-accruals rose to 1.4% in Q1 2026, driven by smaller borrowers; however, given a defensive deal structure where roughly 90% of loans are first lien at a conservative ~40% loan-to-value (LTV), realized losses are expected to remain below the asset class’ approximately 1% annual loss rate over the last two decades.
- Lower interest rates provide relief: The average underlying corporate borrowers’ interest coverage ratio (EBITDA/interest) marginally improved year over year due to lower interest rates and some EBITDA growth.
- Returns have contracted: Weaker performance in Q1 2026 was driven by a multi-year, gradual compression in loan yields alongside the spike in market volatility stemming from geopolitical tensions and AI disruption, more so than fundamental credit degradation within the underlying funds. In particular, this performance softness was most notable among larger borrowers, whose closer alignment with broader credit market fluctuations resulted in more immediate mark-to-market volatility compared to smaller borrowers. Barring systemic credit events, however, conditions may improve in Q2 2026 as market volatility normalizes—a view supported by an early recovery in April performance among reporting funds.
The benchmark report provides two years of historical data for the following metrics:
- PIK interest
- Non-accruals
- Credit loss (net)
- First lien loan FMV / cost
- Borrower debt / EBITDA
- Borrower interest coverage
- Average LTV
- Debt / equity
- Underperformance
- Loan yield
- Annualized quarterly total returns
All metrics are calculated as the median of quarterly fund data based on SEC filings and fund reporting.
1) PIK interest
PIK interest income remained healthy at less than 5%. Levels above 5% could indicate emerging stress, and levels above 10% would signal more widespread stress.

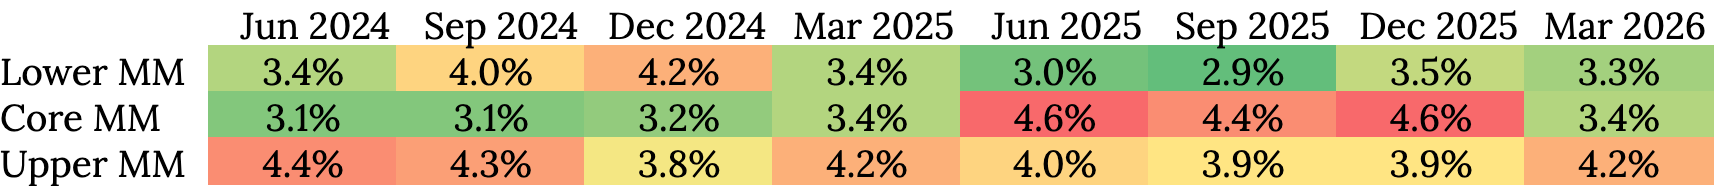
Metric calculation note: PIK interest income is calculated as a percentage of total investment income.
2) Non-accruals
Non-accruals increased in Q1 2026, driven primarily by smaller-sized borrowers. However, historical data suggests a 1.4% non-accrual level will likely result in a realized loss of less than 1%. This expected strong recovery is supported by the deal structure, where approximately 90% of the underlying loans are first lien with a conservative ~40% loan-to-value ratio.

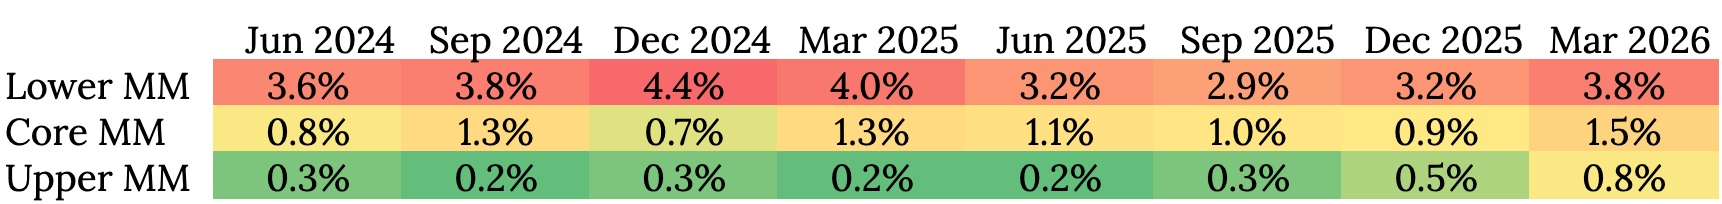
Metric calculation note: Non-accruals is calculated as a percentage of total investments portfolio, based on cost.
3) Credit loss (net)
The following graph shows trailing 12-month realized net losses, which have stayed well within the historical level of ~1% annually over the last two decades for this asset class.

Although the Lower Middle Market (Lower MM) funds have reported higher non-accruals, realized loss has been consistently low in the last three years, supported by more-conservative leverage and interest coverage ratios and more-restrictive financial covenants typical of Lower MM transactions.
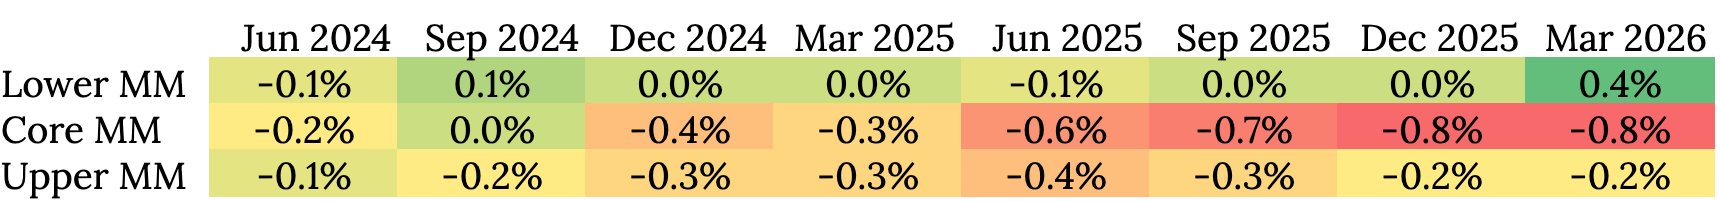
Metric calculation note: Credit loss (net) is calculated as trailing 12-month realized investment loss, net of gain, as a percentage of average fund net asset value.
4) First-lien loan FMV / cost
First-lien loans, which account for approximately 90% of the market, maintained a fair market value (FMV) of 98.8%. While marginally lower than in recent years, this slight softening primarily reflects broader market volatility as risks from ongoing geopolitical tensions are priced across credit markets.

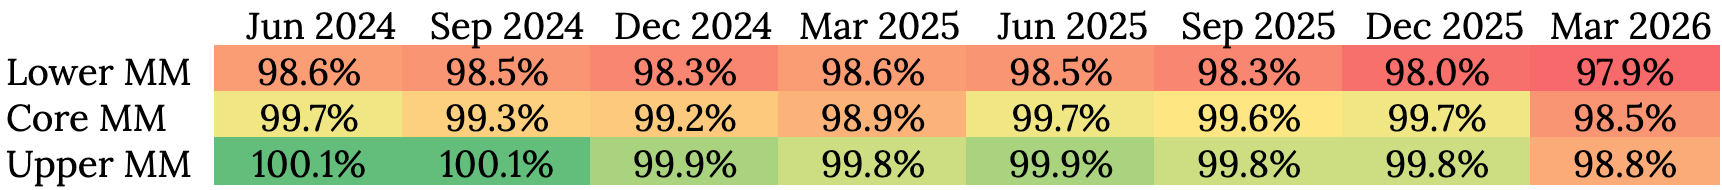
Metric calculation note: First lien loan FMV / cost is calculated as the first lien loan fair market value divided by the cost.
5) Borrower debt / EBITDA
Debt/EBITDA ratios have been stable, with no material upward drift. This suggests lenders have maintained underwriting discipline on borrower leverage in the last three years.

As seen in prior years, as borrower size increases, so does leverage ratio:
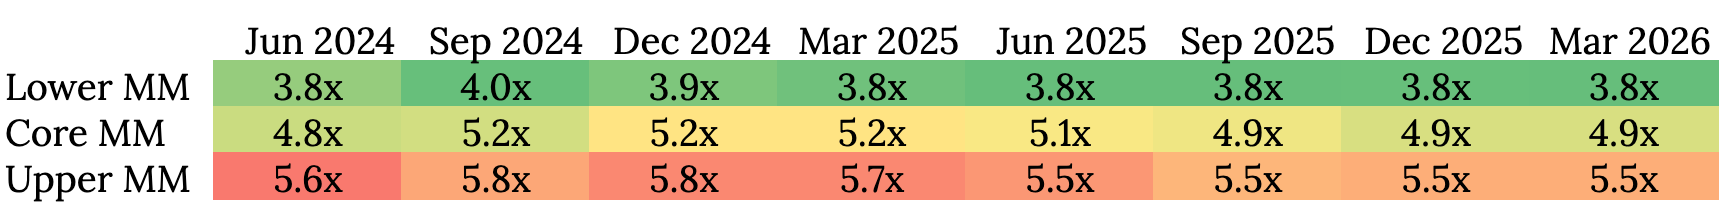
Metric calculation note: Borrower debt / EBITDA is the leverage ratio of the average underlying corporate borrower.
6) Borrower interest coverage
The underlying corporate borrower’s interest coverage ratio (EBITDA/interest) improved year over year due to lower interest rates and some EBITDA growth.

As seen in prior years, as borrower size increases, interest coverage ratio decreases.
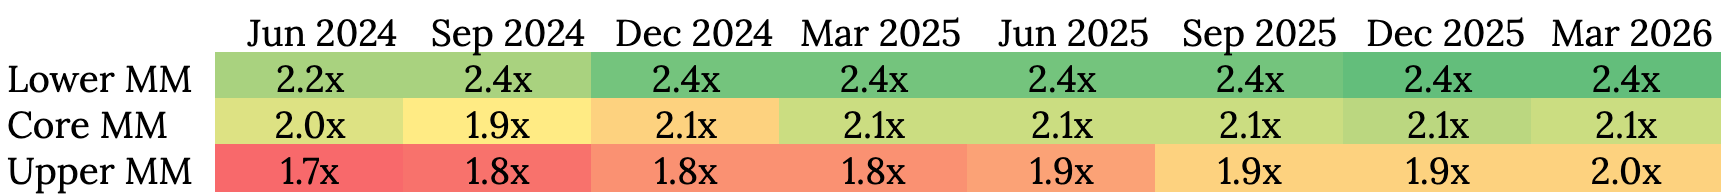
Metric calculation note: Borrower interest coverage is calculated as EBITDA divided by interest expense of the average underlying corporate borrower.
7) Average LTV
Loan-to-value (LTV) ratios remain conservative across segments. Stable LTVs indicate lenders have not materially loosened underwriting standards in the last three years. Such low LTVs allow for a significant first-loss capital cushion should the credit markets deteriorate.

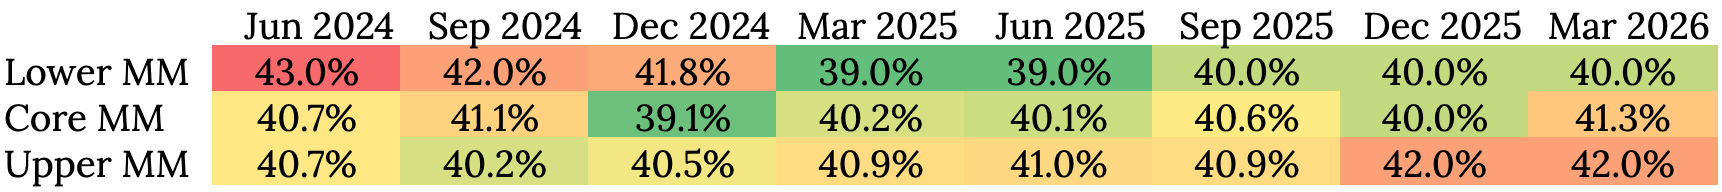
Metric calculation note: Average LTV is calculated as the average loan to value ratio.
8) Debt / equity
Debt to equity ratio (fund-level leverage) has increased, though the current 1.0x level remains manageable. That said, as noted in our prior report, this change warrants continued monitoring, particularly if leverage trends toward 1.2x, as higher levels can amplify losses during periods of market stress.

The quarter-over-quarter increase in fund-level leverage was primarily driven by Core/Upper Middle Market (Core/Upper MM) funds, in part reflecting the inclusion of Core/Upper MM non-traded BDCs being launched in the last two years which are coming off their initial portfolio ramp-up phase. That being said, these leverage trends warrant continued monitoring.
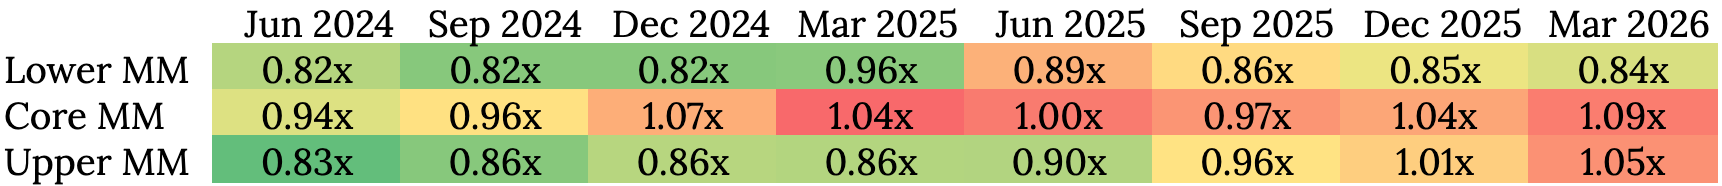
Metric calculation note: Fund leverage is defined as debt / equity.
9) Underperformance
The share of loans performing below fund managers' expectations increased in Q1 2026. While this is a subjective measure and not a reliable indicator of potential realized losses — particularly relative to PIK interest or non-accruals — an accelerating quarter-over-quarter increase in underperformance could signal broader softness.

Underperformance is primarily driven by Lower Middle Market (Lower MM) funds—specifically publicly listed BDCs—whose portfolios hold a higher concentration of legacy, underperforming loans. In contrast, non-traded BDCs (many of which are focused on Upper MM deals) have shown more resilience, as the majority launched after the 2022 rate hike cycle, allowing them to benefit from relatively-cleaner vintages.
Metric calculation note: Underperformance is calculated as the percentage of total investments in a portfolio performing below fund manager's expectations.
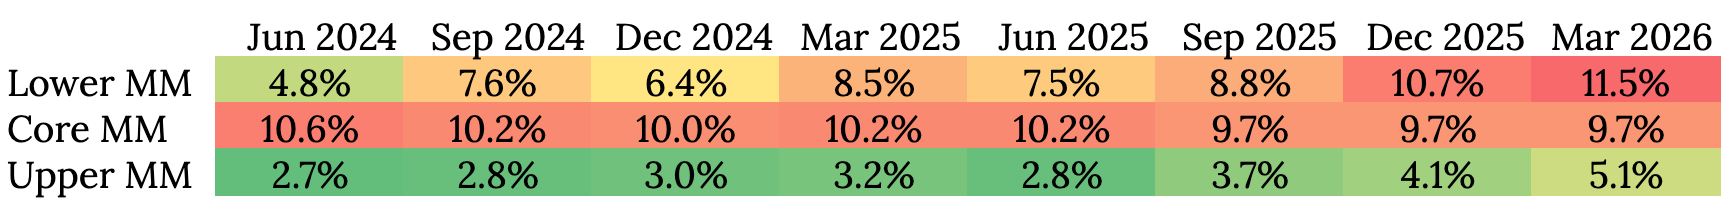
10) Loan yield
Decreasing interest rates have translated into steady quarterly contraction in asset yields across private credit over the last three years.

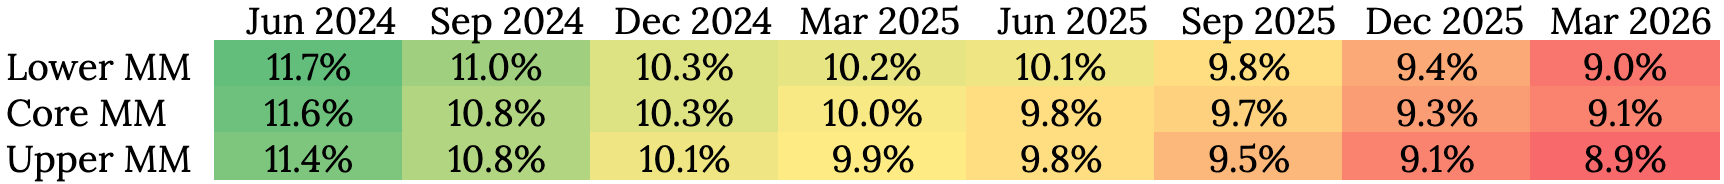
Metric calculation note: Loan yield is calculated as the weighted average asset returns shown as yield based on cost.
11) Annualized quarterly total returns
Returns contracted materially in Q1 2026, driven primarily by market volatility stemming from geopolitical tensions and AI disruption, more so than fundamental credit degradation within the underlying funds. Because this return metric annualizes quarterly performance, short-term trends inherently exhibit greater variance than trailing-12-month metrics. Barring systemic credit events, however, conditions may improve in Q2 2026 as market volatility normalizes—a view supported by an early recovery in April performance among reporting funds.

Performance softness was most notable among Upper Middle Market (Upper MM) funds, which carry greater exposure to liquid credit instruments such as high-yield bonds and broadly syndicated loans. Consequently, these portfolios have moved in tandem with broader credit market volatility, experiencing more immediate mark-to-market fluctuations than Lower Middle Market (Lower MM) funds.
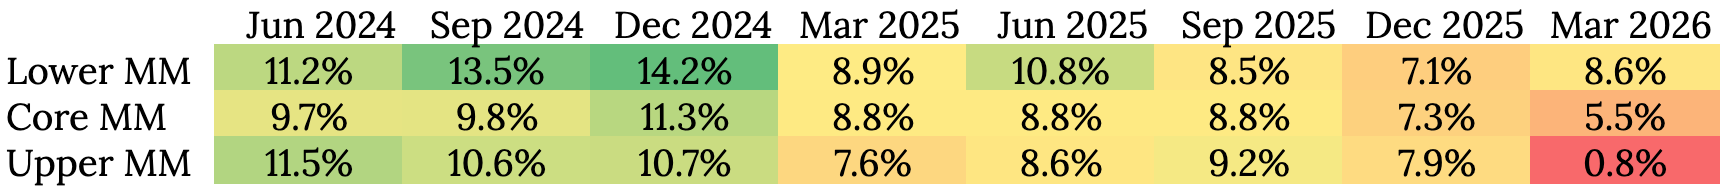
Metric calculation note: Annualized quarterly total returns are calculated by annualizing the most recent quarterly return to fund investors.
About Heron Finance
Heron Finance provides individual investors and family offices with diversified private market investment portfolios with exposure to 27+ funds across 10,000+ private credit, private equity, private infrastructure, and private real estate investments.
With Heron Finance, individual investors gain access to established private market investments while benefiting from:
- A fully digital investing experience
- Low minimum investments
- One consolidated tax form
- Monthly subscriptions (no capital calls)
- No multi-year lockups
- Institutional access
- 1% management fee
Individual investors can invest with Heron in three steps:
- Get a personalized portfolio recommendation — Complete a quick quiz to assess your risk and return preferences. Heron's algorithm builds a tailored private markets portfolio by selecting from experienced institutional funds based on rigorous proprietary scoring criteria.
- Fund your investment — Choose a standard or IRA account, transfer funds via ACH or wire, and verify your accredited investor status.
- Track your returns over time — Once invested, Heron optimizes your portfolio over time and provides a detailed breakdown of your portfolio returns and interest.
See how to invest in private markets with Heron Finance.
Data sources: All metrics are calculated as of Q1 2026 as the median quarterly fund data, based on SEC filings and fund reporting from 69 private credit funds managed by firms with greater than $1 trillion in aggregate private credit AUM. Lower MM refers to lower middle market companies, which report annual EBITDA of less than $25 million; core MM refers to core middle market companies, which report annual EBITDA greater than $25 million but less than $75 million; and upper MM refers to upper middle market companies, which report annual EBITDA greater than $75 million.
Metric explanations:
- PIK interest: PIK interest income as a percentage of gross total investment income
- Non-accruals: Non accruals as a percentage of total investments portfolio, based on cost
- Credit loss (net): Trailing 12-month realized investment loss, net of gain, as a percentage of average fund net asset value
- First lien loan FMV / cost: First lien loan fair market value divided by cost
- Borrower debt / EBITDA: Leverage ratio of average corporate borrower
- Borrower interest coverage: EBITDA divided by interest expense of average corporate borrower
- Average LTV: Average loan to value ratio
- Debt / equity: Average fund-level leverage ratio
- Underperformance: Percentage of total investments portfolio performing below fund manager's expectations, based on fair market value
- Loan yield: Weighted average asset returns shown as yield based on cost
- Annualized quarterly total returns: Investor IRR shown as quarterly returns on annualized basis
Any financial forecasts or financial returns, whether in the form of interest or appreciation displayed on this website are for illustrative purposes only and are not a guarantee of future results. Private market investments are subject to credit, liquidity, and interest rate risk. In the event of any default by a borrower, you will bear a risk of loss of principal and accrued interest on such loan, which could have a material adverse effect on your investment. A borrower may default for a variety of reasons, including non-payment of principal or interest, as well as breaches of contractual covenants. Credit risks associated with the investments include (among others): (i) the possibility that earnings of a borrower may be insufficient to meet its debt service obligations; (ii) a borrower's assets declining in value; and (iii) the declining creditworthiness, default, and potential for insolvency of a borrower during periods of rising interest rates and economic downturn.