The state of private credit benchmark report (Q2 2026 edition)
Key takeaways from an analysis of 73 of the world’s most established private credit funds.

The Q2 2026 edition of the State of Private Credit Benchmark Report analyzes key private credit portfolio and performance metrics using the median of quarterly fund-level data derived from SEC filings and fund reporting as of the end of 2025.
About the state of private credit benchmark report
- The analysis spans 73 U.S. private credit funds, which are further segmented based on underlying borrower size.
- The dataset includes both publicly-listed and non-traded fund vehicles which are managed by firms with more than $1 trillion in aggregate private credit assets under management, providing a representative view of trends and conditions of the private credit market in the U.S. today.
- Metrics are presented over time to highlight trends in portfolio quality, risk characteristics, and return dynamics across the private credit market.
Executive commentary
- PIK interest remains healthy: Payment-in-kind (PIK) interest marginally increased in Q4 2025, but generally remained in line with historical average.
- Non-accrual rate remains moderate: Non-accruals marginally decreased quarter over quarter, with the highest level concentrating in smaller borrowers. On an absolute level, however, non-accrual level is not concerning because most of these loans are first lien with low loan-to-value (LTV) ratio and that the historical realized loss rate for this asset class is approximately 1% annually over the last two decades.
- Lower interest rates provide relief: The average underlying corporate borrower’s interest coverage ratio (EBITDA/interest) improved year over year due to lower interest rates and some EBITDA growth.
- Loan quality is stable: We don’t see material credit risk deterioration at the industry level, especially considering the fact that at the end of the day, LTV remains healthy at about 40% and that approximately 90% of the loans are first lien loans, which historically recovered well above 50% in a default scenario.
The benchmark report provides two years of historical data for the following metrics:
- PIK interest
- Non-accruals
- Credit loss (net)
- First lien loan FMV / cost
- Borrower debt / EBITDA
- Borrower interest coverage
- Average LTV
- Debt / equity
- Underperformance
- Loan yield
- Annualized quarterly total returns
All metrics are calculated as the median of quarterly fund data based on SEC filings and fund reporting.
1) PIK interest
PIK interest income (as a percentage of total investment income) below 5% suggests no systemic concerns. Levels above 5% could indicate emerging stress, and levels above 10% would signal more widespread, systemic stress across the industry.
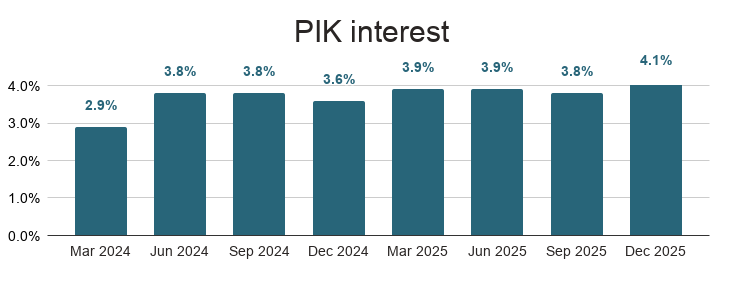

Metric calculation note: PIK interest income is calculated as a percentage of total investment income.
2) Non-accruals
Non-accrual levels remain moderate, especially by historical standards, with stronger performance among larger borrowers.
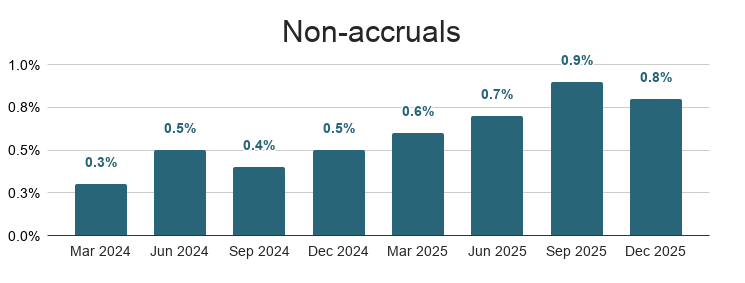

Metric calculation note: Non-accruals is calculated as a percentage of total investments portfolio, based on cost.
3) Credit loss (net)
The following graph shows trailing 12-month realized losses (net of realized gains), which have stayed well within the historical level of ~1% annually over the last two decades for this asset class.
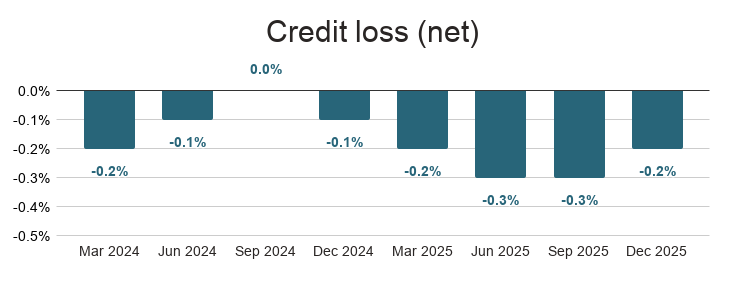
Although the Lower Middle Market has reported higher non-accruals, realized credit loss performance has been stronger, supported by generally better debt/EBITDA and interest coverage ratios and more-restrictive financial covenants typical of smaller borrowers.

Metric calculation note: Credit loss (net) is calculated as trailing 12-month realized investment loss, net of gain, as a percentage of average fund net asset value.
4) First-lien loan FMV / cost
First-lien loan fair market values (FMV) remain generally close to par, indicating limited stress across first-lien loan holdings, which account for close to 90% of the industry.
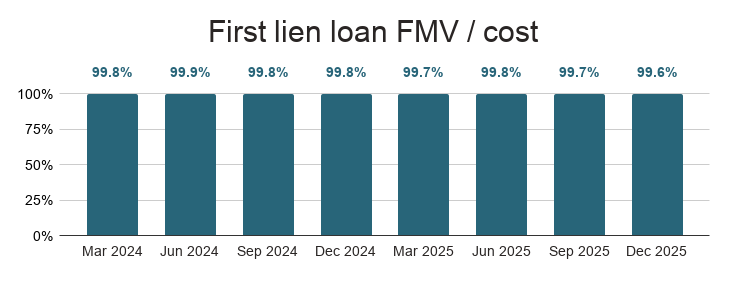

Metric calculation note: First lien loan FMV / cost is calculated as the first lien loan fair market value divided by the cost.
5) Borrower debt / EBITDA
Leverage levels have been broadly stable, with no material upward drift. This suggests lenders have maintained discipline on borrower leverage in the last two years.
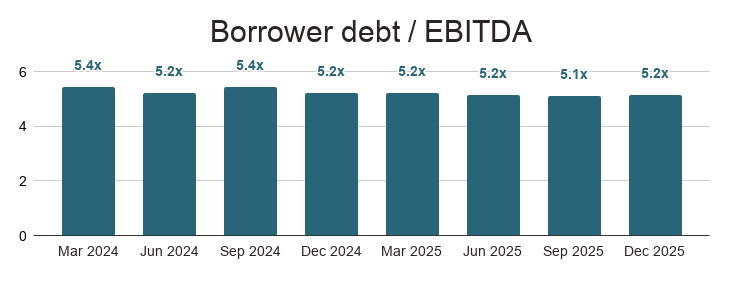
As seen in prior years, as borrower size increases, so does leverage ratio:

Metric calculation note: Borrower debt / EBITDA is the leverage ratio of the average underlying corporate borrower.
6) Borrower interest coverage
The underlying corporate borrower’s interest coverage ratio (EBITDA/interest) improved year over year due to lower interest rates and some EBITDA growth.
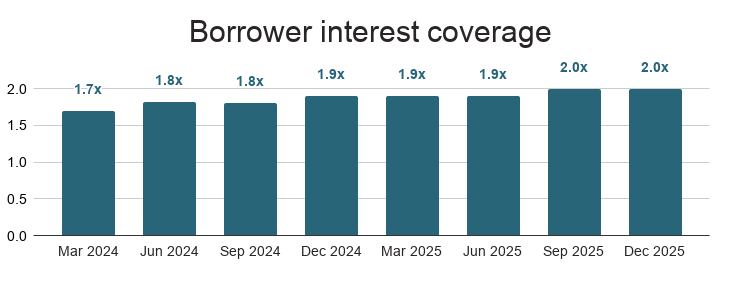
As seen in prior years, as borrower size increases, interest coverage ratio decreases.

Metric calculation note: Borrower interest coverage is calculated as EBITDA divided by interest expense of the average underlying corporate borrower.
7) Average LTV
Loan-to-value ratios remain conservative across segments. Stable LTVs indicate lenders have not materially loosened underwriting standards in the last two years. Such low LTVs allow for a significant first-loss capital cushion should the credit markets deteriorate.
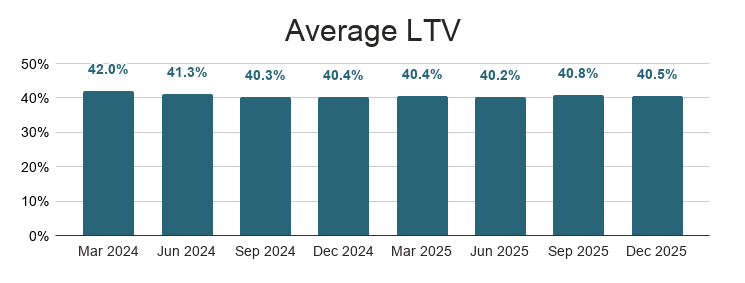

Metric calculation note: Average LTV is calculated as the average loan to value ratio.
8) Debt / equity (fund-level leverage)
Fund-level leverage has increased, though the current 1.0x debt-to-equity ratio remains manageable. That said, this warrants continued monitoring, particularly if leverage trends toward 1.2x, as higher levels can amplify losses during periods of market stress.
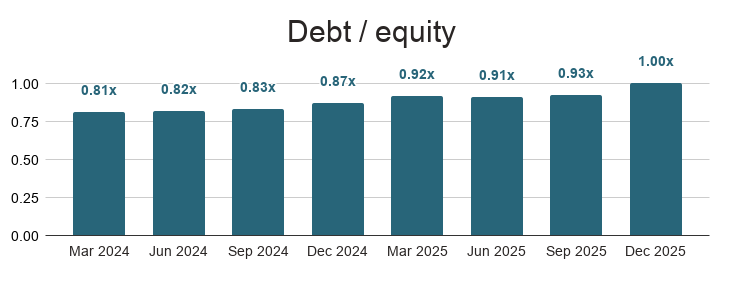
The quarter-over-quarter increase in fund-level leverage was driven primarily by Upper Middle Market funds in Q4 2025, in part reflecting the inclusion of recently launched non-traded BDCs that are still in the portfolio ramp-up phase. Nevertheless, these trends warrant continued monitoring.

Metric calculation note: Fund leverage is defined as debt / equity.
9) Underperformance
The share of loans performing below fund managers' expectations declined in Q4 2025. While this is a subjective measure and not a reliable predictor of realized losses — particularly relative to non-accruals — an accelerating quarter-over-quarter increase in underperformance could signal broader softness.
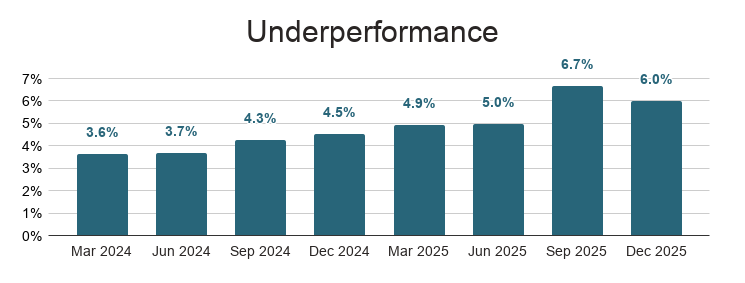

Metric calculation note: Underperformance is calculated as the percentage of total investments in a portfolio performing below fund manager's expectations.
10) Loan yield
Decreasing interest rates have translated into steady quarterly decreases in asset yields across the private credit industry over the last two years.
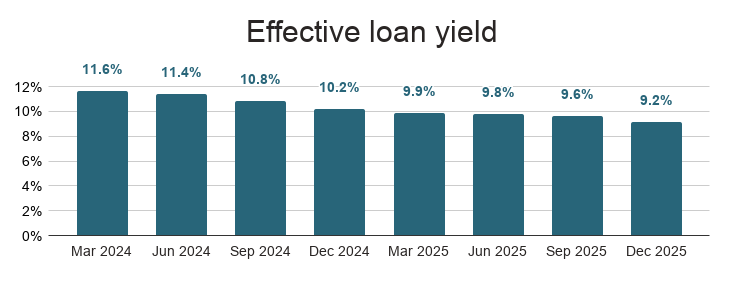

Metric calculation note: Loan yield is calculated as the weighted average asset returns shown as yield based on cost.
11) Annualized quarterly total returns
Annualized returns normalized over 2025 after strong periods in 2023-2024. Performance dispersion across market segments has narrowed over time.
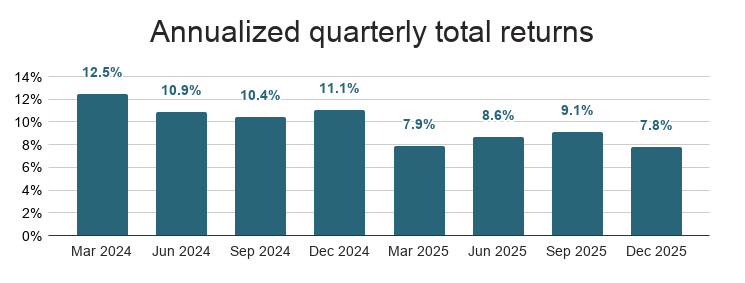

Metric calculation note: Annualized quarterly total returns are calculated by annualizing the most recent quarterly return to fund investors.
About Heron Finance
Heron Finance provides individual investors and family offices with diversified private market investment portfolios with exposure to 26+ funds across 10,000+ private credit, private equity, private infrastructure, and private real estate investments.
With Heron Finance, individual investors gain access to established private market investments while benefiting from:
- A fully digital investing experience
- Low minimum investments
- One consolidated tax form
- Monthly subscriptions (no capital calls)
- No multi-year lockups
- Favorable share class
- 1% management fee
Individual investors can invest with Heron in three steps:
- Get a personalized portfolio recommendation — Complete a quick quiz to assess your risk and return preferences. Heron's algorithm builds a tailored private markets portfolio by selecting from experienced institutional funds based on rigorous proprietary scoring criteria.
- Fund your investment — Choose a standard or IRA account, transfer funds via ACH or wire, and verify your accredited investor status.
- Track your returns over time — Once invested, Heron optimizes your portfolio over time and provides a detailed breakdown of your portfolio returns and interest.
See how to invest in private markets with Heron Finance.
Data sources: All metrics are calculated as of Q4 2025 as the median quarterly fund data, based on SEC filings and fund reporting from 73 private credit funds managed by firms with greater than $1 trillion in aggregate private credit AUM. Lower MM refers to lower middle market companies, which report annual EBITDA of less than $25 million; core MM refers to core middle market companies, which report annual EBITDA greater than $25 million but less than $75 million; and upper MM refers to upper middle market companies, which report annual EBITDA greater than $75 million.
Metric explanations:
- PIK interest: PIK interest income as a percentage of gross total investment income
- Non-accruals: Non accruals as a percentage of total investments portfolio, based on cost
- Credit loss (net): Trailing 12-month realized investment loss, net of gain, as a percentage of average fund net asset value
- First lien loan FMV / cost: First lien loan fair market value divided by cost
- Borrower debt / EBITDA: Leverage ratio of average corporate borrower
- Borrower interest coverage: EBITDA divided by interest expense of average corporate borrower
- Average LTV: Average loan to value ratio
- Debt / equity: Average fund-level leverage ratio
- Underperformance: Percentage of total investments portfolio performing below fund manager's expectations, based on fair market value
- Loan yield: Weighted average asset returns shown as yield based on cost
- Annualized quarterly total returns: Investor IRR shown as quarterly returns on annualized basis
Any financial forecasts or financial returns, whether in the form of interest or appreciation displayed on this website are for illustrative purposes only and are not a guarantee of future results. Private credit investments are subject to credit, liquidity, and interest rate risk. In the event of any default by a borrower, you will bear a risk of loss of principal and accrued interest on such loan, which could have a material adverse effect on your investment. A borrower may default for a variety of reasons, including non-payment of principal or interest, as well as breaches of contractual covenants. Credit risks associated with the investments include (among others): (i) the possibility that earnings of a borrower may be insufficient to meet its debt service obligations; (ii) a borrower's assets declining in value; and (iii) the declining creditworthiness, default, and potential for insolvency of a borrower during periods of rising interest rates and economic downturn.