How Much of Your Portfolio Should You Allocate to Private Credit?
Many investors in private credit want to know what percentage of their portfolio they should allocate to the alternative asset. This article leverages institutional investor allocations to derive an answer.

Many investors are starting to do something they’ve never done before: Diversify their portfolio away from stocks and bonds. Their reasons range from extreme volatility (both stocks and bonds have produced negative annual returns in recent years) to a growing correlation between the two (stocks and bonds have been moving in the same direction lately, when traditionally they have had an inverse relationship).[1]
This has prompted investors to consider alternative assets–anything not a stock or bond. Real estate, cryptocurrency, and precious metals are natural starting points, as those are the alternatives that have typically been the easiest to access. Yet private markets are becoming more accessible, thanks to digital platforms like Heron Finance which allow accredited investors to invest in private credit. Similar platforms exist for private equity and venture capital.
As a private credit-focused robo advisor, we’ve been noticing that prospective investors are asking two very important questions as they consider investing in this burgeoning asset class:
- How much of my portfolio should I allocate to private credit?
- What will the impact of private credit be on my portfolio (in other words, what expectations should I have here)?
Our short answers to those two questions are:
- At least 10%
- Higher long-term returns and lower volatility than simply investing in stocks and bonds, with less liquidity
But those are just the cliff notes. The following article will help you understand how we derived that 10% number, and why introducing private credit into your portfolio can produce those three outcomes (higher returns, lower volatility and less liquidity).
Key Highlights:
- Investors are turning to alternative assets to diversify their portfolios away from traditional stocks and bonds, which have grown highly correlated in recent years
- Institutional investors are targeting around an 8% allocation to private credit, and are increasing their current allocations to meet that target number
- Heron Finance recommends that accredited investors invest at least 10% of their portfolio into private credit, with an expectation of higher returns, lower volatility and less liquidity than if they had just invested in stocks and bonds
The Death of the 60/40, and the Birth of the 33/33/33
There’s been a lot of talk lately about the death of the 60/40 portfolio. If you haven’t already heard, many financial advisors, including prominent institutional investors, are recommending that their clients shift away from the traditional 60/40 stock-to-bond split.
The reasons for this are the aforementioned volatility in both assets (which is expected to continue), as well as the positive correlation (the whole point of a 60/40 portfolio is that bonds historically increase in value when stocks plummet. If they both lose value at the same time, as they have recently, then what’s the point of a 60/40?).
Some new allocation percentages are being tossed around–40/40/20, and 33/33/33–with that third bucket being an allocation to alternative assets.[2] So if you follow the advice of prominent institutions, you might allocate somewhere between 20-33% of your portfolio to alternatives.
As a robo advisor that provides accredited investors with access to private credit deals, we tend to stick to the higher end of that range, and recommend investors allocate a full ⅓ of their portfolio to alternatives. Of course, ‘alternative assets’ is an umbrella term for any investment that’s not a publicly-traded stock or bond. Examples are real estate, cryptocurrency, fine art, precious metals and private companies. For more information on alternative assets, read our comprehensive guide to the asset class.
Given the wide range of alternatives at an investor’s disposal, the question for Heron Finance investors remains: How much should I allocate to private credit specifically?
The Smartest Guys in the Room
One way of answering that question is to look at how institutional investors are allocating their own portfolios.
A survey of institutional investors representing $3 trillion of assets under management found that they have a target allocation of 7.8% to private credit. The same survey found that the institutional investors currently allocate an average of 5.7% of their portfolios to private credit, though survey respondents expressed an interest in increasing their allocation percentage over the near-term.[3]
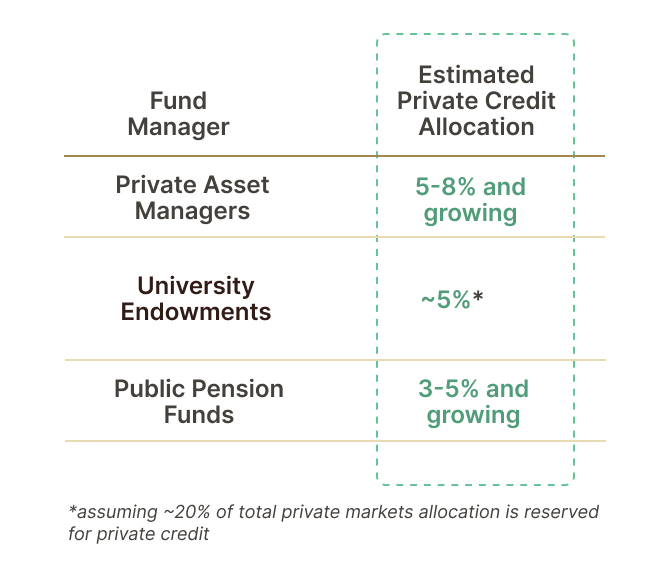
Blackstone Group, the largest alternative asset manager in the world, with $1 trillion in assets under management,[4] currently manages a $150 billion private credit portfolio, accounting for 15% of its total portfolio allocation.[5] To be clear, Blackstone is a fund manager, not an LP, but as the largest alternative asset manager in the world, is indicative of the direction of the overall market.
The average university endowment allocates 23% of its portfolio to private markets generally, while leading university endowments invest upwards of 30%.[6] While we were unable to verify what portion of that figure is allocated to private credit specifically, we did come across a Cambridge Associates survey which found that the average allocation to private credit by US public pension funds is 3%.[7] Cambridge Associates–a global investment firm–notes that it advocates for an increased allocation among many of its clients.
University endowments and public pensions are generally more conservative than their private asset manager counterparts, and also tend to be laggards when it comes to adopting cyclical investment trends. So even though the allocations to private credit amongst this cohort are more modest, it can be assumed that they will eventually play catch up as private asset managers like Blackstone allocate double-digital percentages of their total portfolio to the asset class.
In fact, CalPERS, the largest public pension fund in the U.S., has already announced plans to increase its allocation to private credit. A recent proposal will increase total private market allocations from 33% to 40%, with private credit increasing from 5% to 8%.[8] CalPERS’ one-year return for private credit, which was established as a separate asset class within the portfolio in 2022, was 13.3% as of the end of 2023.
This push into private credit isn’t localized to the U.S. market–global institutions are taking the same approach. GIC, Singapore’s sovereign wealth fund (and one of the largest in the world), recently announced plans to allocate more investment into the private credit sector.[9] ADIA, the Abu Dhabi sovereign wealth fund, has also announced a deeper move into private credit via a $1 billion investment deal with Goldman Sachs (GS, by the way, is in the midst of its own private credit expansion, from $130 billion in AUM to $300 billion).[10]
Based on the above data, we can surmise the following:
If ‘the smartest guys in the room’ (institutional investors who earn millions of dollars doing this for a living) are collectively allocating anywhere from 3% on the low-low end to 15% on the high end, with a target of around 8%, then the average accredited investor should probably allocate at least 10% of their portfolio to private credit.
That ‘at least 10%’ figure comes from taking the target 8%, and building in an additional ‘liquidity factor.’
What is a liquidity factor, you ask? Private credit has traditionally been a highly illiquid asset, so when institutional investors think about investing in private credit, they usually assume their capital will be locked up for at least 3-5 years.
However, Heron Finance offers a novel approach to liquidity, which allows us to target liquidity in as little as 30 days from the date of redemption request. Accredited investors investing on the Heron Finance platform can therefore allocate a slightly higher percentage of their portfolio to private credit, given that they maintain the possibility of liquidating their investment 30 days after a request is made (please note–we do not guarantee 30 day liquidity. Our goal is to make a best effort to meet redemptions at least 30 days from the date of request).
So in other words, if institutional investors are targeting an 8% allocation to private credit, accredited investors can target at least 10% because of the enhanced liquidity Heron Finance affords them.
This figure tracks with how prominent financial advisors are thinking about private credit allocation. For example, New Edge Wealth, a Stamford, CT investment company, states, “We believe that private credit should consist of anywhere from 30%-50% of a private market allocation.”[11] If a private markets allocation is 33% of an overall portfolio, that implies that private credit should encompass 10-17% of the total portfolio.
Admittedly, we are being somewhat conservative with our ‘at least 10%’ recommendation. Investors may very well decide to allocate more than that to this burgeoning sector of the financial markets.
What to Expect When You’re Expecting Private Credit
Once the appropriate allocation is determined, the next most obvious question is: How should I expect a private credit investment to impact my portfolio?
There are three major roles that private credit plays in a given portfolio:
1. Higher Returns than Stocks: As the chart below indicates, private credit produces higher returns than stocks over long-term time horizons.
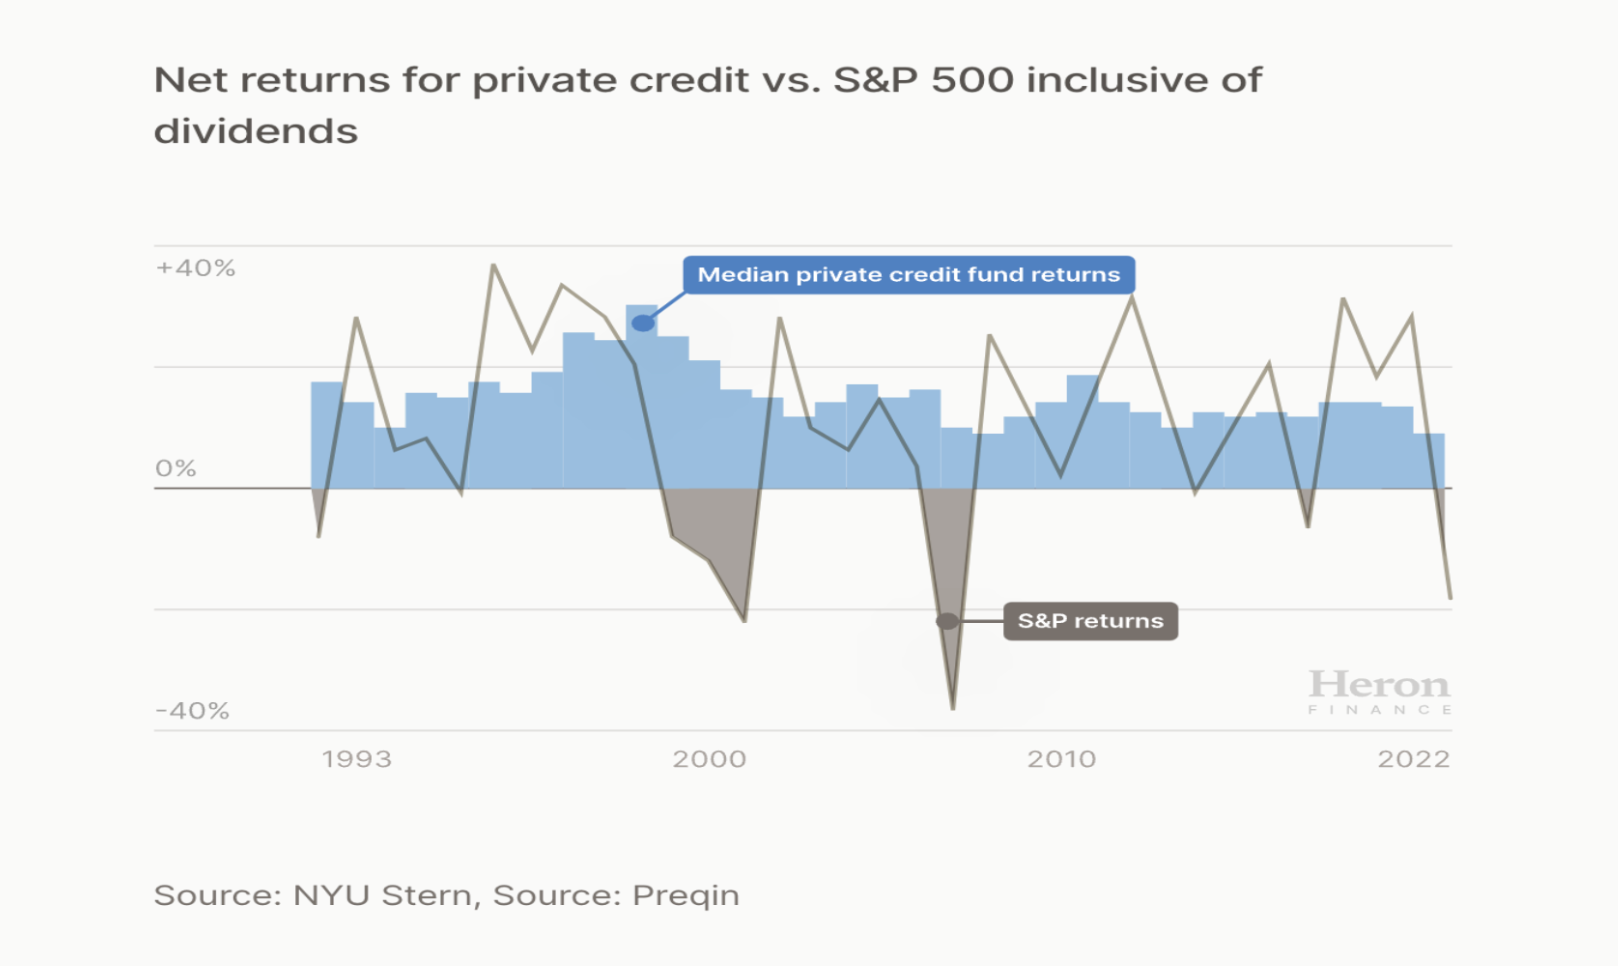
From 1989-2023, the compound annual growth rate (CAGR) of the S&P 500 was 10.24%.[12] Over that same time period, the median private credit manager’s CAGR was 11.16%.[13] That might not seem like a huge difference at first glance, but investing $10,000 into private credit over that time period would have yielded you $52,000 more than if you had invested the same amount into the S&P! And that comes with much lower historical volatility as well.
While past performance is not an indicator of future performance, this data illustrates how private credit has produced superior returns to the stock market over the last 30+ years.
2. The Consistent Cash Flow of Bonds: Private credit investments produce consistent cash flow, much like traditional bond investments. This helps smoothe over portfolio volatility.
During that same 1989-2023 time period, the volatility index for an all-stock portfolio measures a 3.1% standard deviation with 7 negative years, and a 1.6% standard deviation with 9 negative years for a more conservative 60/40 stock-to-bond portfolio.[14] In contrast, the median private credit manager produced a miniscule 0.15% standard deviation, and had no negative years during that time.[15]
Said another way, the median private credit fund manager has had no negative years over the last three decades!
The resulting chart below indicates how impactful private credit can be in a given portfolio. Not only does the CAGR increase when private credit is added, but the overall volatility and number of losing years drastically decreases.
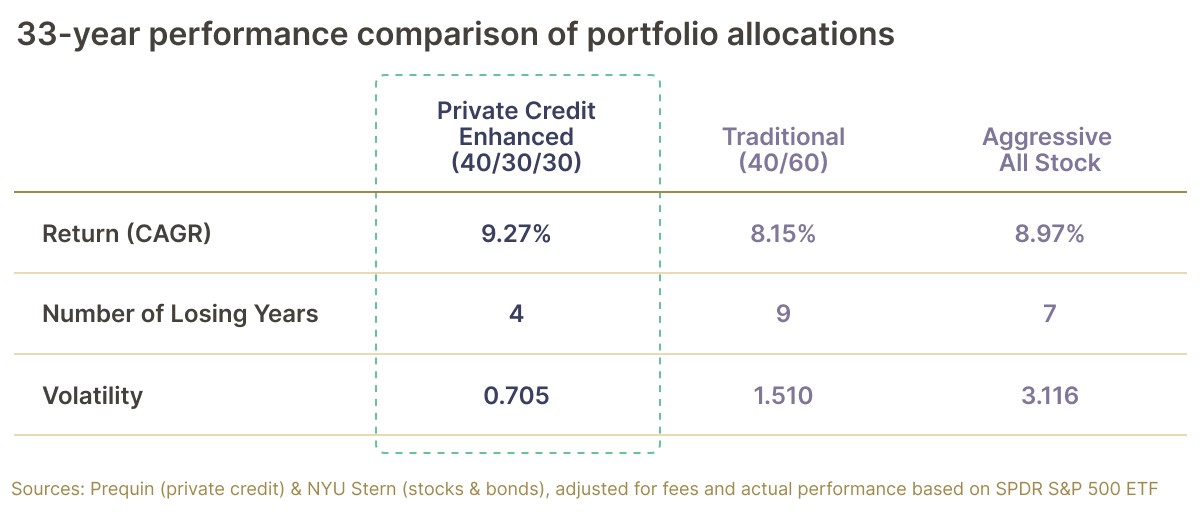
At this point you might be wondering, if a 30% allocation to private credit increases CAGR and smoothes out portfolio volatility to such a degree as indicated in the above chart, why aren’t we recommending a 30% allocation for accredited investors?
It’s a good question! There is certainly an argument to be made for increasing one’s portfolio allocation to private credit, given the above statistics. However, there is one other portfolio impact that investors in private credit should be aware of.
3. Illiquidity: As mentioned earlier, private credit is an inherently illiquid asset class. So unlike stocks and bonds, investors in private credit shouldn’t assume that they can simply place a sell order and liquidate their position. It is entirely possible that a private credit investment will lock up your capital for many years.
That said, Heron Finance is taking certain steps to achieve ‘liquidity in as little as 30 days’, which we mentioned previously. The key step we are taking is maintaining liquidity in reserve.
The typical private credit fund doesn’t do this because it looks to invest rather than hold a significant amount of assets in cash, which generates no return. Hence private credit funds don’t often liquidate investor positions. Investors in those funds assume a long lockup period, which they are (at least somewhat) comfortable with given the fact that they are institutional investors.
Heron Finance is the first robo-advisor exclusively focused on private credit. Our users are accredited investors who are more sensitive to the idea of locking up capital for long periods of time. After all, you might need that money to account for an unforeseeable life change.
For that reason, we have structured our approach to liquidity very differently than the typical credit fund, and this is what allows us to offer liquidity in as little as one quarter from the date of request. To be clear–this is not a secondary market. There is no peer-to-peer swapping of positions. Instead, we have allocated a portion of our own balance sheet capital specifically for the purpose of repurchasing positions that our clients would like to sell.
Due to the inherent illiquid nature of private credit, accredited investors might consider a somewhat lower allocation to private credit than the 30% indicated in the chart above. Even though Heron Finance is targeting liquidity in as little as 30 days, there is no guarantee that we will be able to meet that target (a spike in defaults leading to a rush of redemption requests could elongate the process, for example).
So for that reason, we are recommending accredited investors allocate at least 10% of their portfolio to private credit.
In Conclusion
While there is no universally agreed-upon percentage, the target allocation to private credit of around 8% by institutional investors, and the average allocation of 3% by U.S. public pensions provide some guidance. These figures, however, should be adapted based on individual investor profiles, including risk tolerance, investment objectives, and market conditions.
In the end, an investor’s allocation to private credit is a personal decision. We recommend that such an allocation be made strategically, taking into account the current economic environment, the strength of the investor’s overall portfolio, and the investor’s age (younger investors may prefer to invest aggressively with larger stock and/or crypto allocations, while older investors might invest more conservatively, with larger private credit and bond allocations).
Source: Investopedia ↩︎
Source: Blackstone ↩︎
Source: Hamilton Lane ↩︎
Source: Cambridge Associates ↩︎
Source: New Edge Wealth ↩︎
Source: data from Preqin ↩︎
Source: data from Preqin ↩︎